
At first glance, Anatomy of a Habitable Planet looks like a photograph of an alien world. However, you’re really looking into a mirror.
"This seemingly alien world is actually our endangered planet, Earth, as a distant civilisation might study it," explains Sergio Díaz Ruiz, IT engineer, data scientist and astrophotographer from Seville, Spain.
He says, "This image was created by mixing the 16 bands monitored by the GOES-18 weather satellite to show landmasses, oceans and atmospheric features as different colours."
Sergio’s work earned him the Annie Maunder Prize for Image Innovation, a category of Astronomy Photographer of the Year that celebrates the fusion of science and art.
Take a deep dive into Sergio’s image: where the data came from, how it was created, and how astronomical artistry can help us to reflect on climate change.
Image

Anatomy of a Habitable Planet by Sergio Díaz Ruiz
"Magec-f is the most intriguing planet ever discovered. The only known world with signs compatible with life. Using multispectral imaging, astronomers have been able to reveal the hidden structures and patterns that lie beyond our perception. The planet’s surface is covered with diverse features and large oceans under swirling clouds and storms. But what makes Magec-f truly unique is the potential presence of intelligent life. Some measurements, such as the strange abundance of certain greenhouse gases or the overly bright light patterns on the night side, suggest an artificial origin. But these life forms, if they exist at all, may not be so intelligent, as these are also the signs of an ongoing global catastrophe,” explains Sergio.
“This seemingly alien world is actually our endangered planet, Earth, as a distant civilization might study it. This image was created by mixing the 16 bands monitored by the GOES-18 weather satellite to encode landmasses, oceans and atmospheric features as different colours. Calibration level 1b data from the GOES-18 ABI 16-band instrument and the Earth Observation Group’s high-resolution global Night-time Lights map were used to assemble this image. In PixInsight, the fourth channel image was used to enhance the lightness of the clouds and then colour grading was applied in several steps to achieve the final result.”
Finding inspiration: seeing Earth from space
Unlike other astrophotography awards, the Annie Maunder Prize for Image Innovation does not require you to actually take your own image. Instead, the category encourages entrants to manipulate publicly available astronomy data in innovative ways.
“I started exploring public archives, looking for scientific data I could use for my image,” says Sergio. “I selected probably the most unlikely target for astrophotography: the Earth itself.”
Previous entrants and winners of the category have tended to look beyond our blue planet; for example, 2023 winner John White visualised the sound of a black hole millions of light years away using water droplets on a speaker, while 2022 winner Pauline Woolley mapped the Sun’s 12-year solar cycle onto tree rings.
Sergio’s decision to look at Earth naturally invites a reflection on the health of our planet. Fittingly, he has used a tool that is on the cutting edge of climate change monitoring and analysis: Earth observation satellites.
Satellites and climate change
A steady stream of artificial satellites are launched into orbit around Earth on a weekly basis. Predictions of exact numbers vary, but over 9,000 are thought to be orbiting us right now according to the UK government.
Satellites perform a range of functions critical to our daily lives, from providing global positioning systems (GPS) and worldwide internet connectivity to facilitating international communications, weather forecasting and broadcasting.

They can also be used for scientific research that would be nearly impossible to undertake from the ground.
This includes measuring ozone trends, air quality, climate and sea level changes, air pollution, ice-sheet collapse, atmospheric carbon dioxide levels and more.
Satellites allow us to explore beyond what can be seen with the naked eye. They’re fitted with a range of sophisticated instruments that take measurements in various wavelengths across the electromagnetic spectrum, revealing crucial information about the state of Earth – and offering people like Sergio a unique way of exploring our planet.
Finding the data
Get ready for some acronyms. Sergio says, “I found these observations of Earth from the NOAA (the National Oceanic and Atmospheric Administration) NASA GOES (Geostationary Operational Environmental Satellites) 18 satellite.”
The GOES-18 satellite was launched in 2022 and is the third in the GOES-R series - “the Western Hemisphere’s most sophisticated weather-observing and environmental-monitoring system” according to NOAA.
Geostationary means that the satellite is in orbit directly above the equator and moves at the same rate as the Earth, completing one orbit of Earth for each time Earth rotates on its axis. This means that from our perspective the satellite appears to be stationary in the sky and takes images of the same area.
GOES-18 monitors the west of the western hemisphere, working alongside the older GOES-16 which monitors the east. Together they cover roughly half of the globe.

GOES-18 measures a range of things including weather systems developing over the Pacific Ocean (which helps to predict weather heading for the USA), wildfires, clouds, hurricanes, river water levels (and the potential for flooding), smoke, dust, air quality, volcanic activity, sea surface temperature (which might affect marine life) and extremes in space weather that could create communications blackouts.
On board both the GOES-16 and GOES-18 satellites is the Advanced Baseline Imager, also known as ABI. It is an imaging radiometer (an instrument which measures radiation) with 16 different channels or ‘spectral bands’, which measure energy at different wavelengths along the electromagnetic spectrum.
For example, Band 1 takes images in the ‘blue’ section of visible light, and primarily monitors smoke and aerosols.
Band 4 is also called the ‘Cirrus Band’, as it collects data in a near-infrared wavelength that can detect high-altitude daytime cirrus clouds.
Meanwhile, Band 7 – the ‘Shortwave Infrared Band’ – collects data in infrared on fog, low clouds, fires and volcanic ash, and can be used to estimate the temperature of the sea surface.
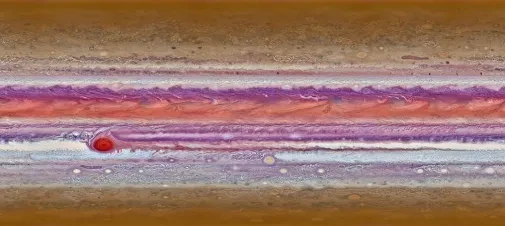
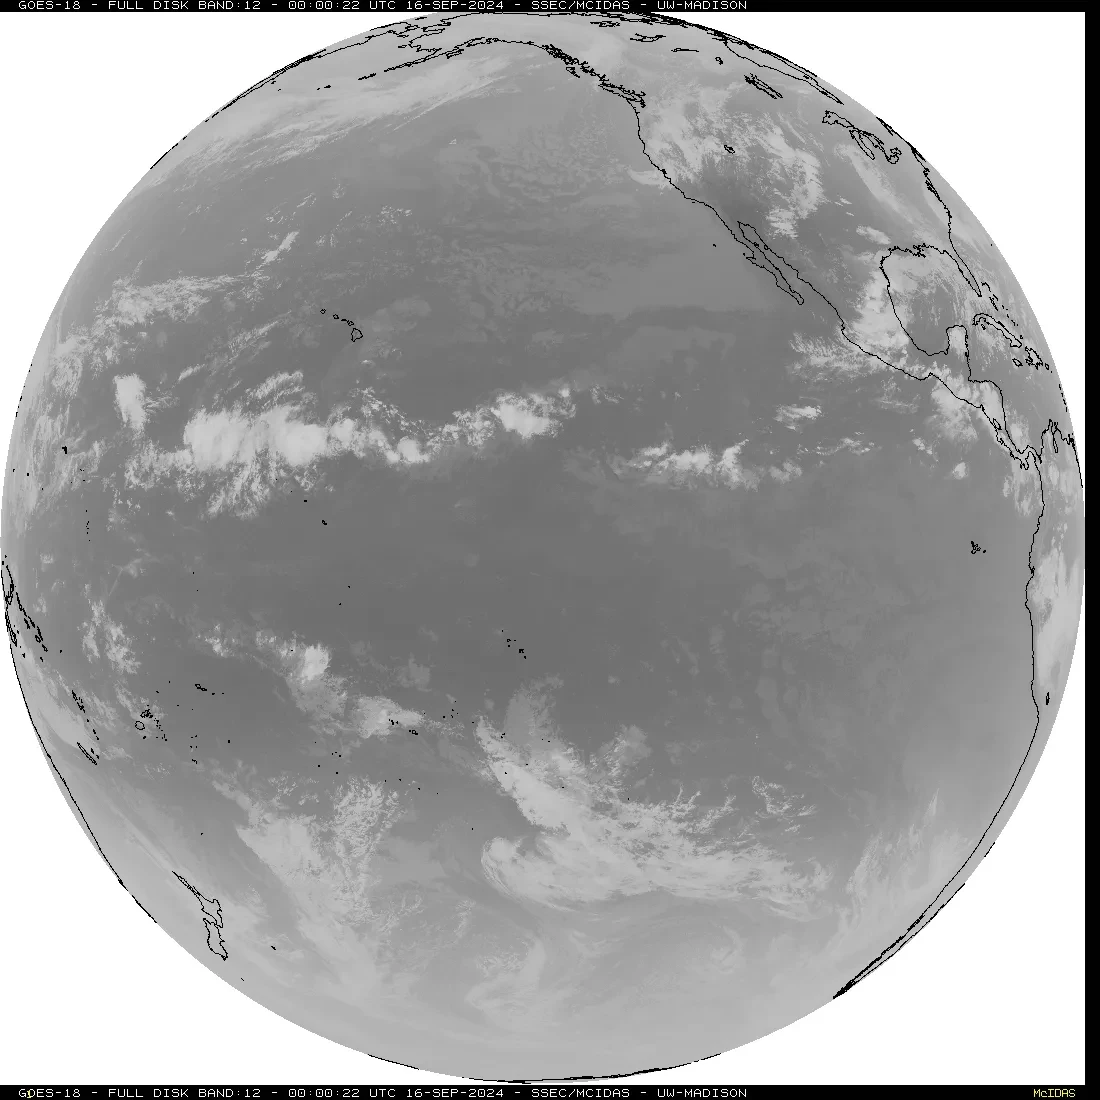
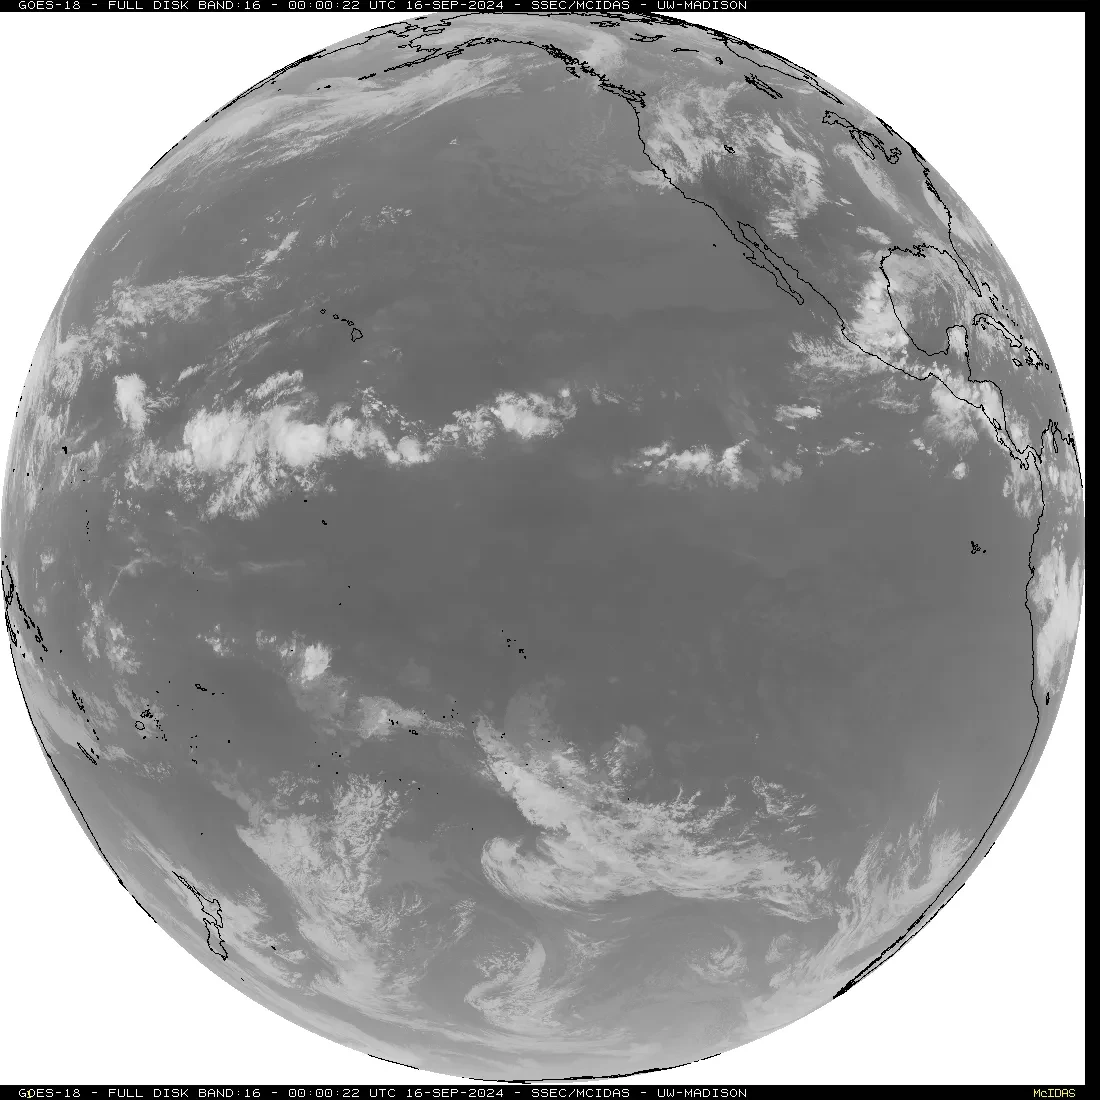
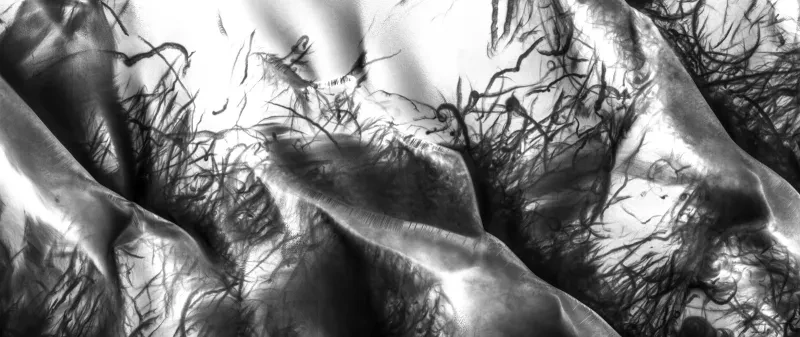
Below is data collected by GOES-18 at the same time in six different spectral bands:
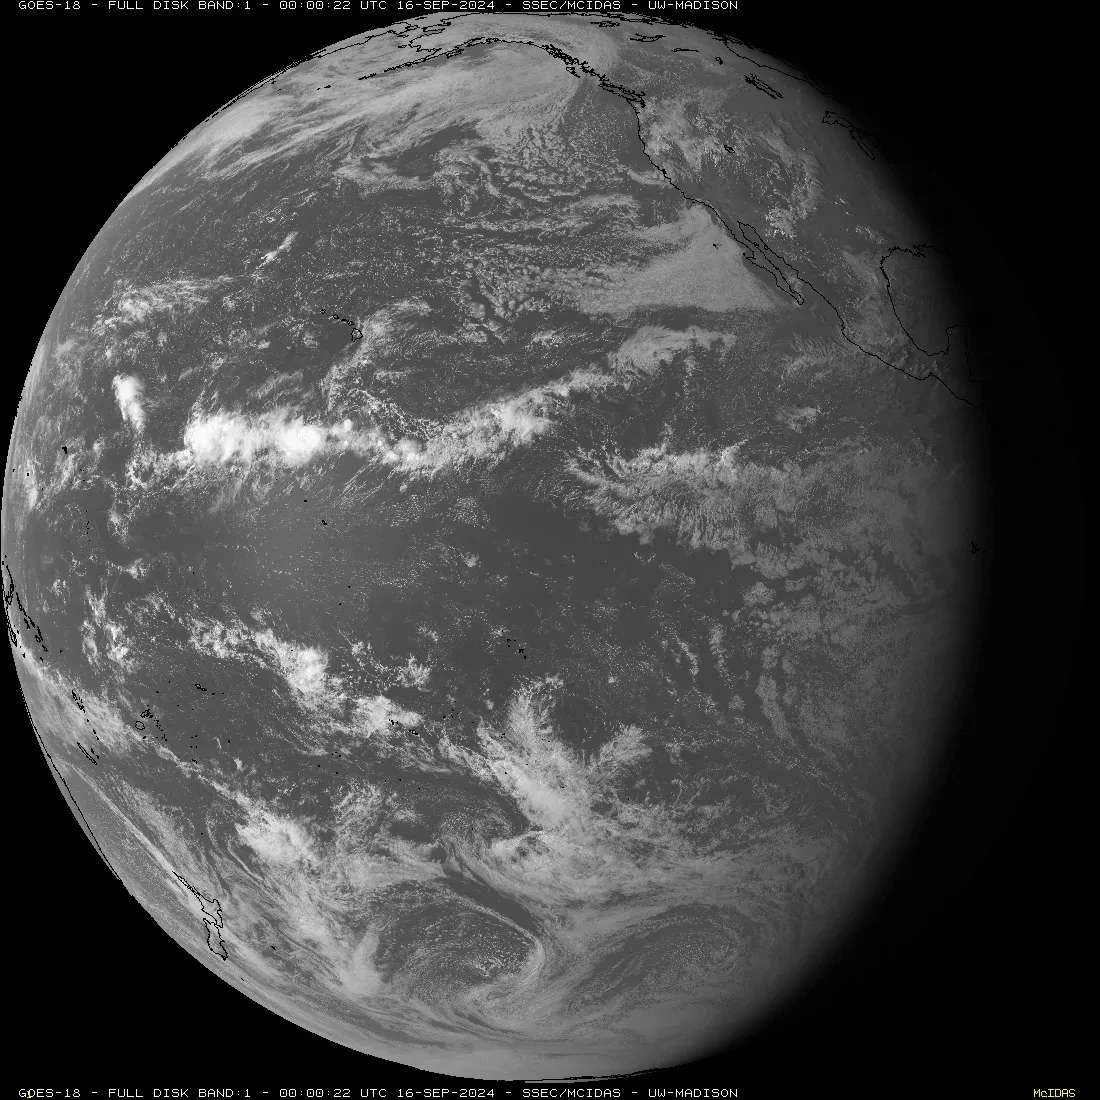
1 / 6
Visible blue - Band 1
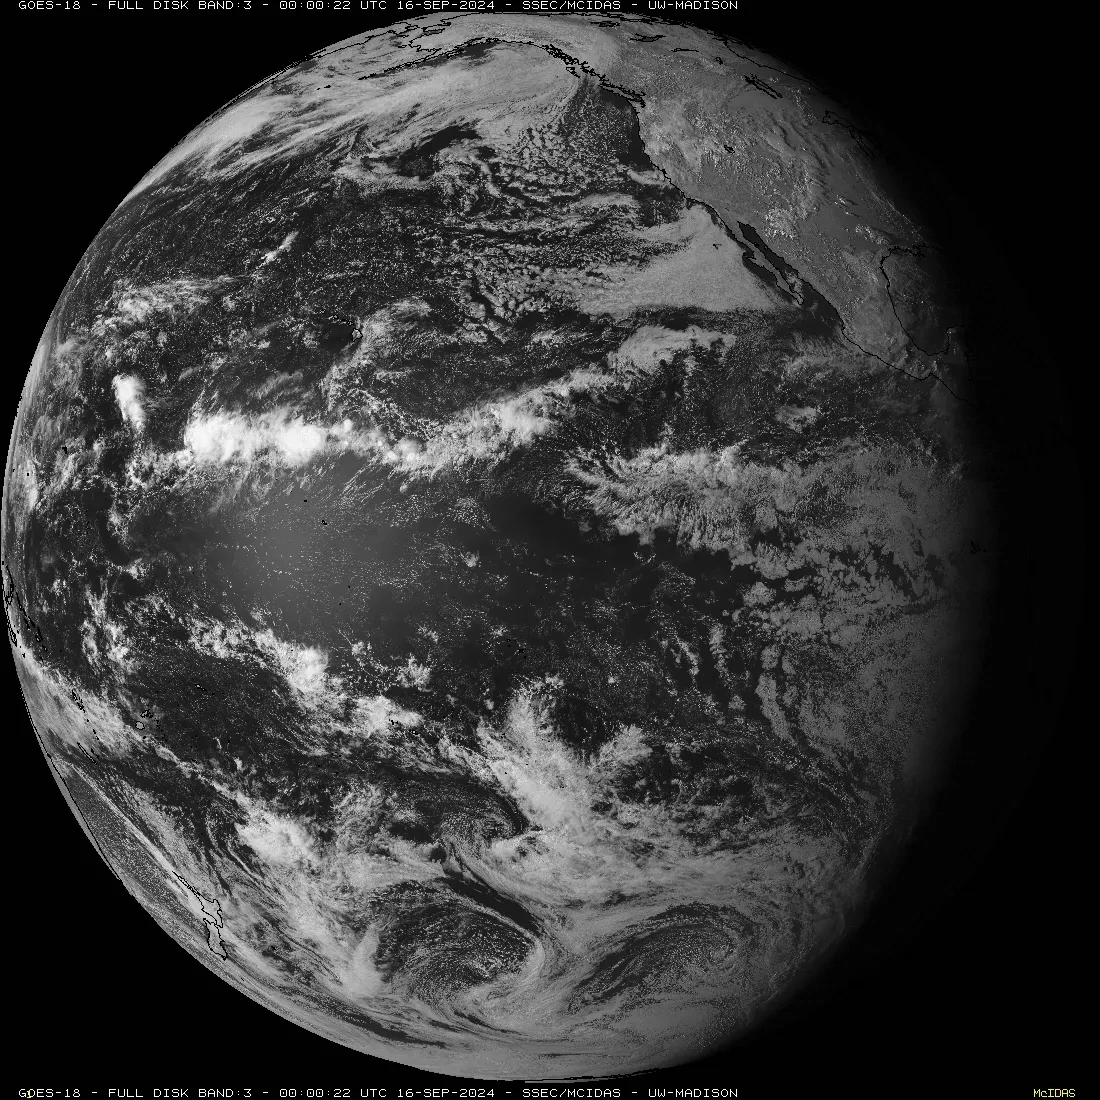
2 / 6
Near Infrared - Vegetation Band 3
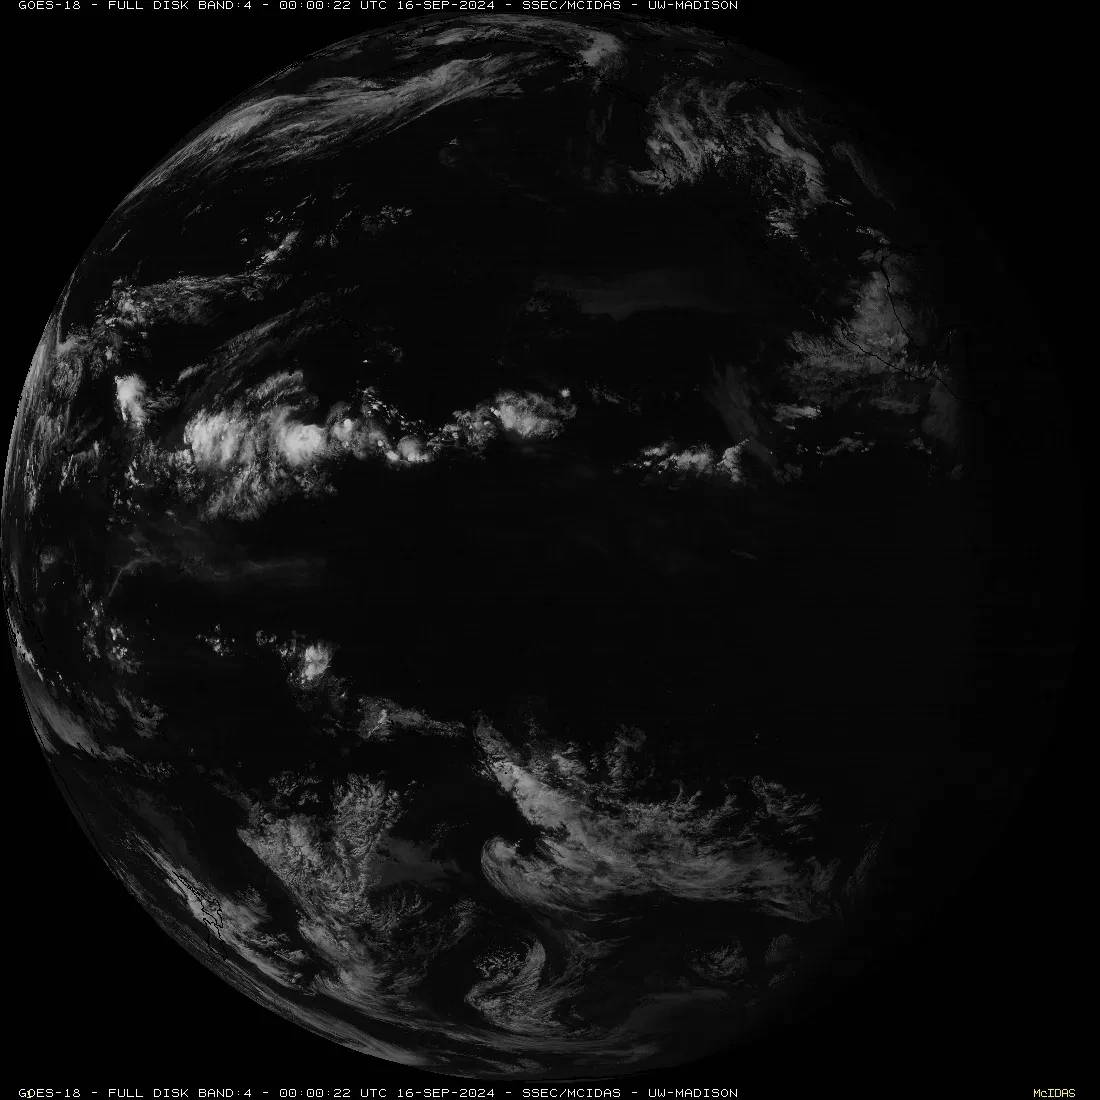
3 / 6
Near Infrared - Cirrus Band 4
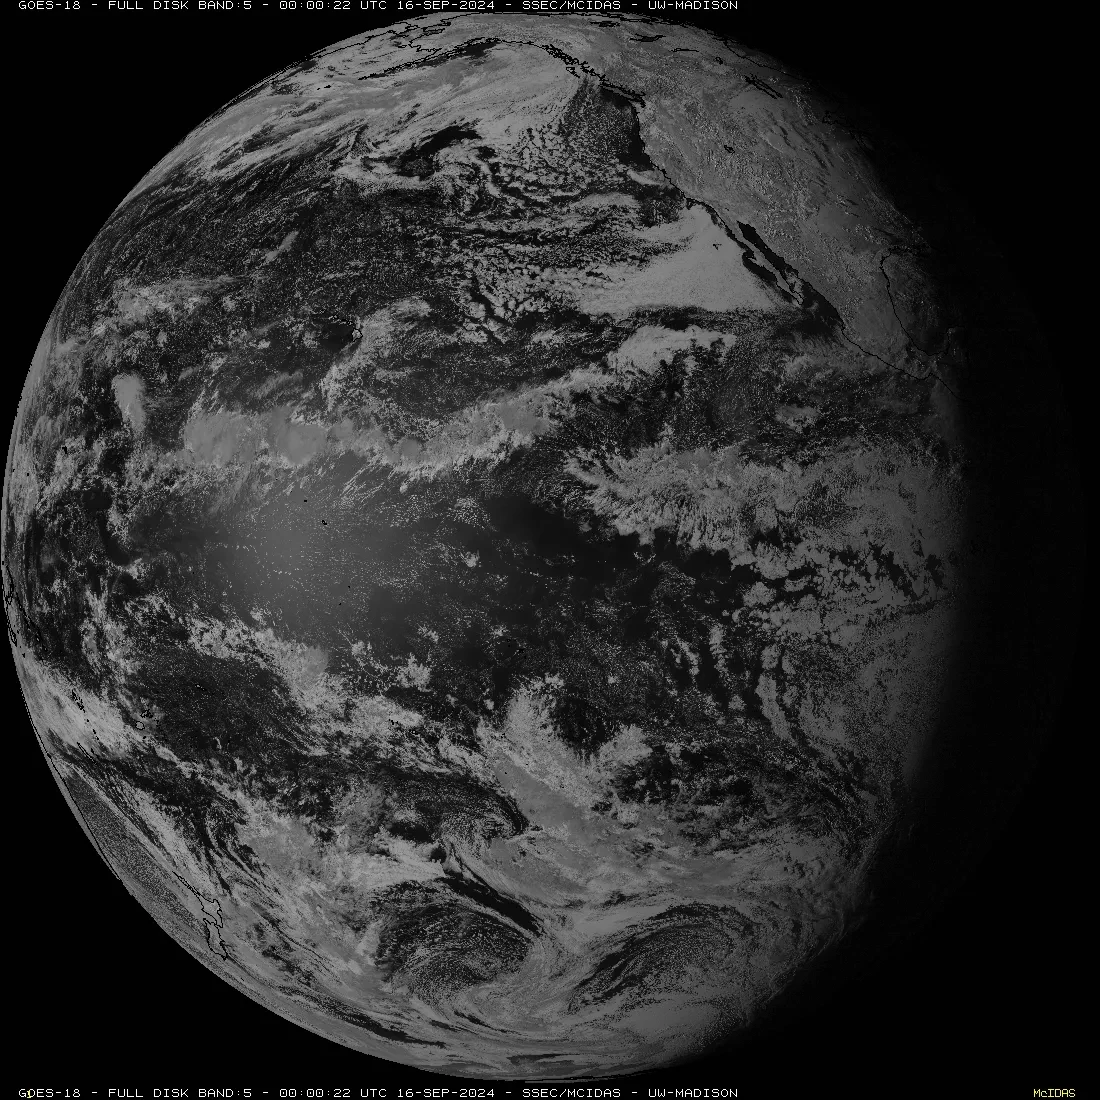
4 / 6
Near Infrared - Snow/ice Band 5
5 / 6
Infrared - Ozone Band 12
6 / 6
Infrared - Co2 Longwave Band 16
Night Time Lights: mapping light pollution
Sergio also used data from the Earth Observation Group's high-resolution global Night Time Lights map, taken from the Suomi National Polar-orbiting Partnership satellite (NPP). The instruments aboard “provide global daily measurements of nocturnal visible and near-infrared (NIR) light,” according to NASA.

Whilst visually interesting, what can light mapping actually tell us about the human impact on Earth?
“VIIRS Day/Night Band (DNB) data are used for estimating population, assessing electrification of remote areas, monitoring disasters and conflict, and understanding biological impacts of increased light pollution,” says NASA.
Sergio explains, “Light pollution is energy waste. We don't need all those lights, and part of the energy we don't use is going to the atmosphere and it stops us from seeing the stars.”
As the final step in creating Anatomy of a Habitable Planet, the greyscale night lights layer was colourised and overlaid on top of the image, masking the cloud-covered areas.
Simplifying complex data
‘Dimensionality reduction’ is the process of taking a complex set of data – like that from the multiple instruments on board the GOES-18 satellite – and simplifying it, whilst still retaining the meaning of the original data.
“It was an idea I had when I was studying data science: to use techniques of dimensionality reduction on astrophotography,” says Sergio.
“There are 16 observations from GOES-18, but on a computer you only have red, green and blue. That's three dimensions, so you have to reduce from 16 to only three."
Sergio developed a custom tool to perform dimensionality reduction, as well as to simplify the selection of the colour palette.
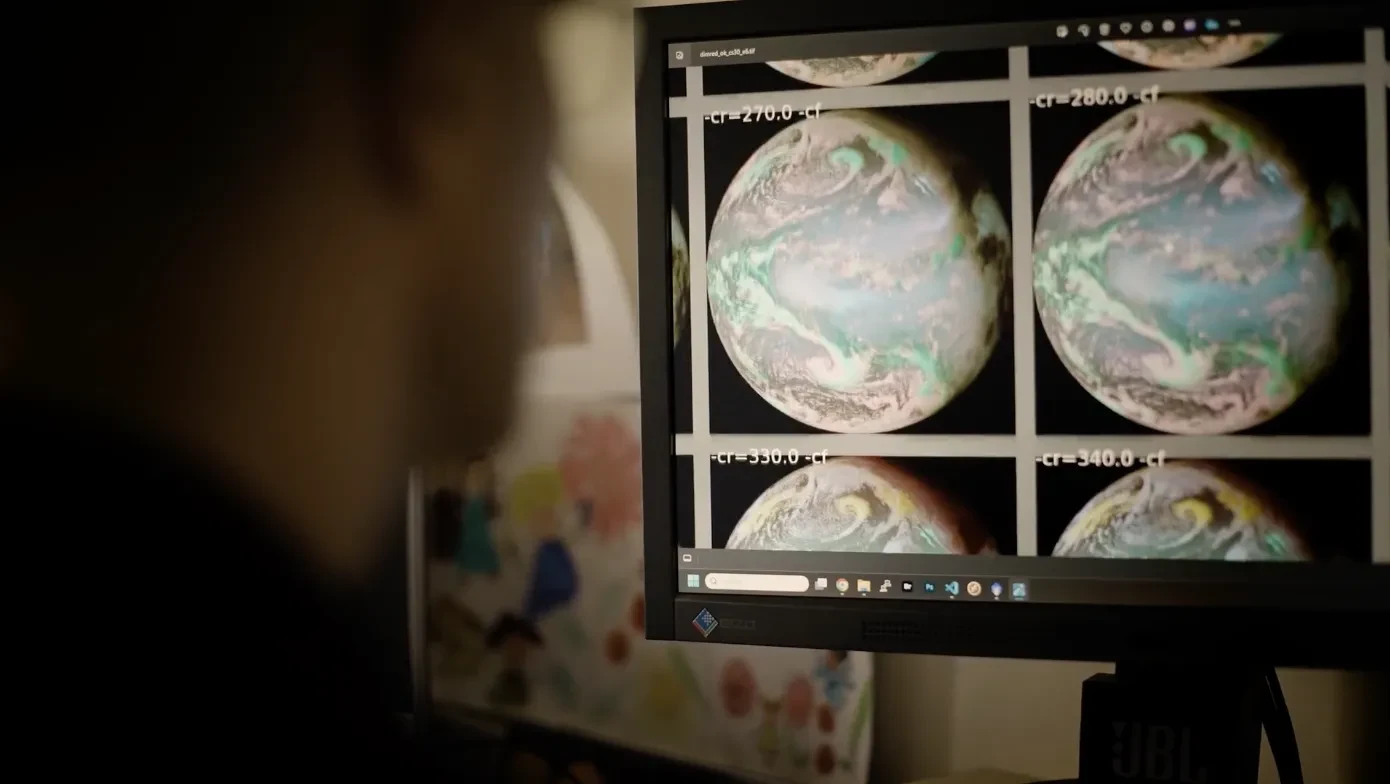
“Selecting the colour palette [for astrophotography] is like when painters decide on what range of colours to use for their work. We have to do the same in astrophotography, because we are visualising colour that we cannot see,” says Sergio.
Seeing the result
As he was building up the layers of the image, Sergio saw something promising taking shape on his computer screen.
He says, “I didn't expect that result. So when it first came out, I was surprised and that encouraged me to continue the processing.
“When I showed the image to my family, they were impressed and they asked me what planet it is – so I had to tell them that it was really Earth that we were looking at.
“I think it shows a completely different view of our planet,” Sergio reflects. “And maybe with this different view, we can in some way think about what we’re doing to our planet. Sooner or later, we will have to tackle this problem.”
You can explore more of Sergio's work on his website.
This strangely familiar representation of the Earth transforms scientific data through colour mapping to highlight the devastation already inflicted on our world. The image poignantly emphasises the significant environmental challenges we face and the urgent need to protect and preserve our planet.
Victoria Lane, competition judge
Visit the exhibition
Find more stories from Astronomy Photographer of the Year
Beads of sunlight: photographing an annular solar eclipse
Ryan Imperio's spellbinding image of our Sun earned him the top prize in Astronomy Photographer of the Year 2024
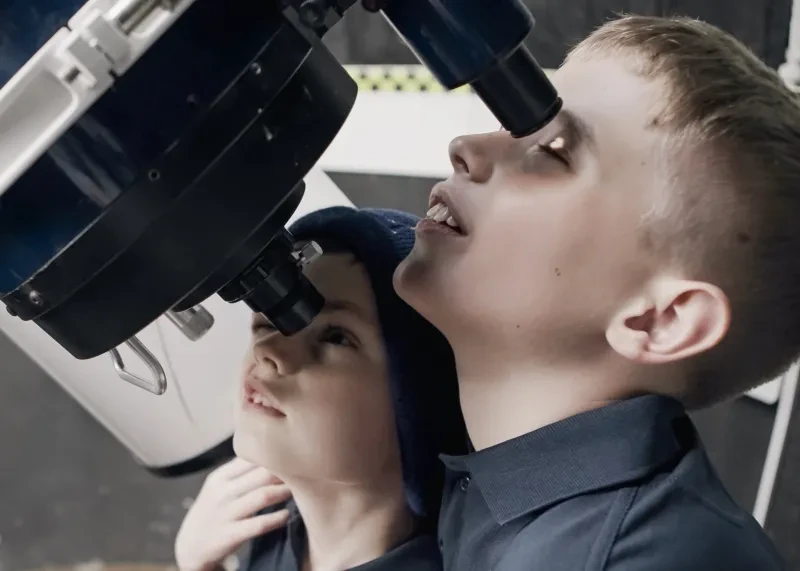
A stellar duo: two young astrophotographers shooting for the stars
Meet the youngest entrants in Astronomy Photographer of the Year 2024: brothers Benjamin and Joshua Lawler
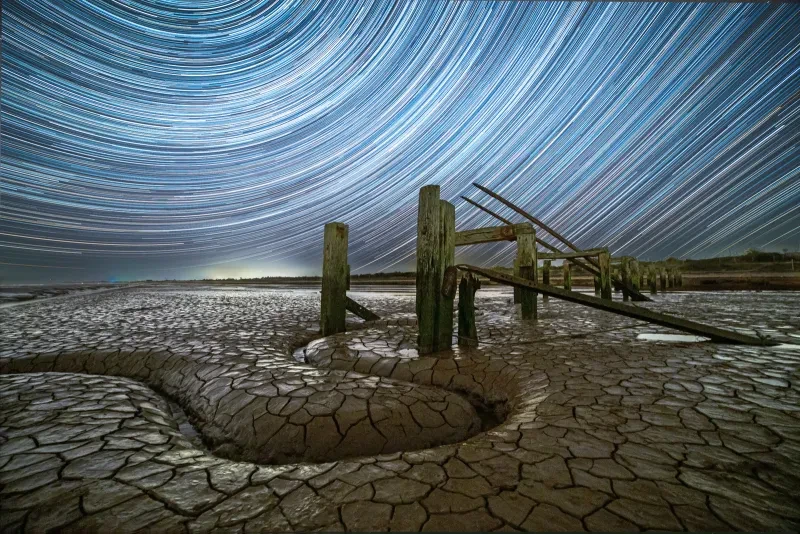
'Out with the camera, my senses are heightened' – behind the lens with Paul Haworth
Discover the vibrant nocturnal world of East Anglian astrophotographer Paul Haworth, shortlisted in 2024's Astronomy Photographer of the Year competition
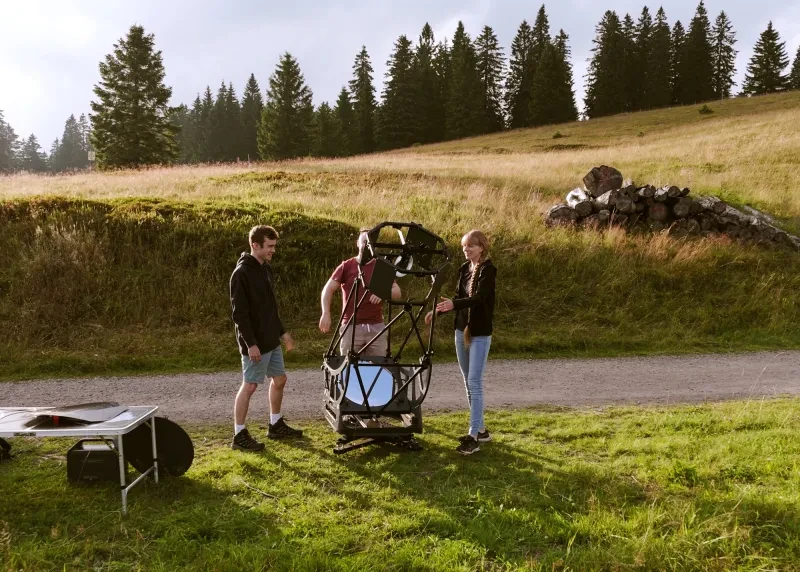
Finding community through astrophotography
Sophie Paulin and Tom Williams struck up a friendship in an online astrophotography forum. Discover how they combined their expertise to win a prize in Astronomy Photographer of the Year
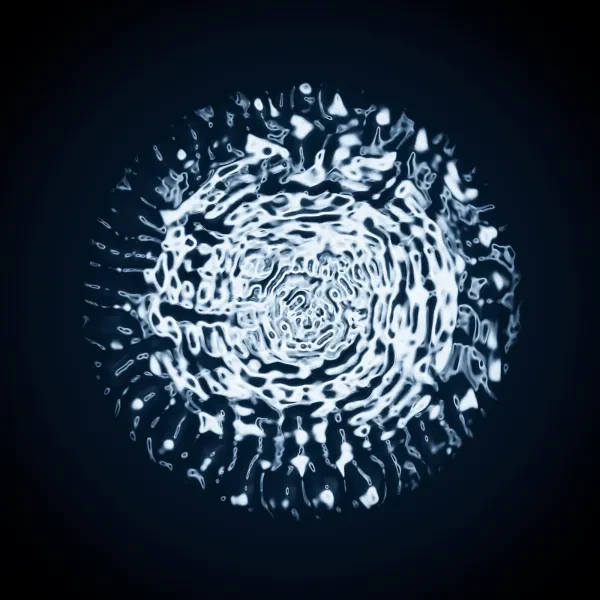
Seeing the sound of a black hole: the story of Black Echo
How do you picture something that is invisible and inaudible to humans? Artist and photographer John White has the answer
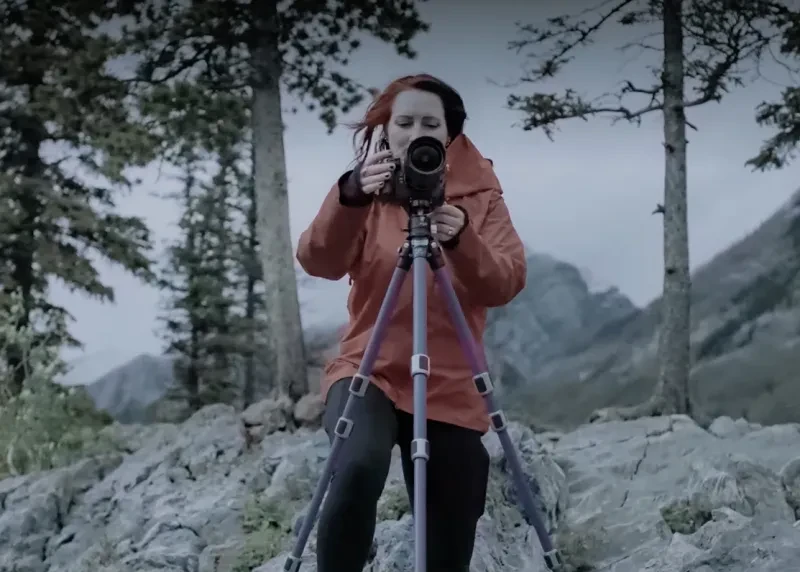
Behind the lens with Monika Deviat
Dancer, educator, heavy metal fan and astrophotographer, discover more about the Aurorae winner of Astronomy Photographer of the Year 2023